

Open your Overview in the Requesty Console.
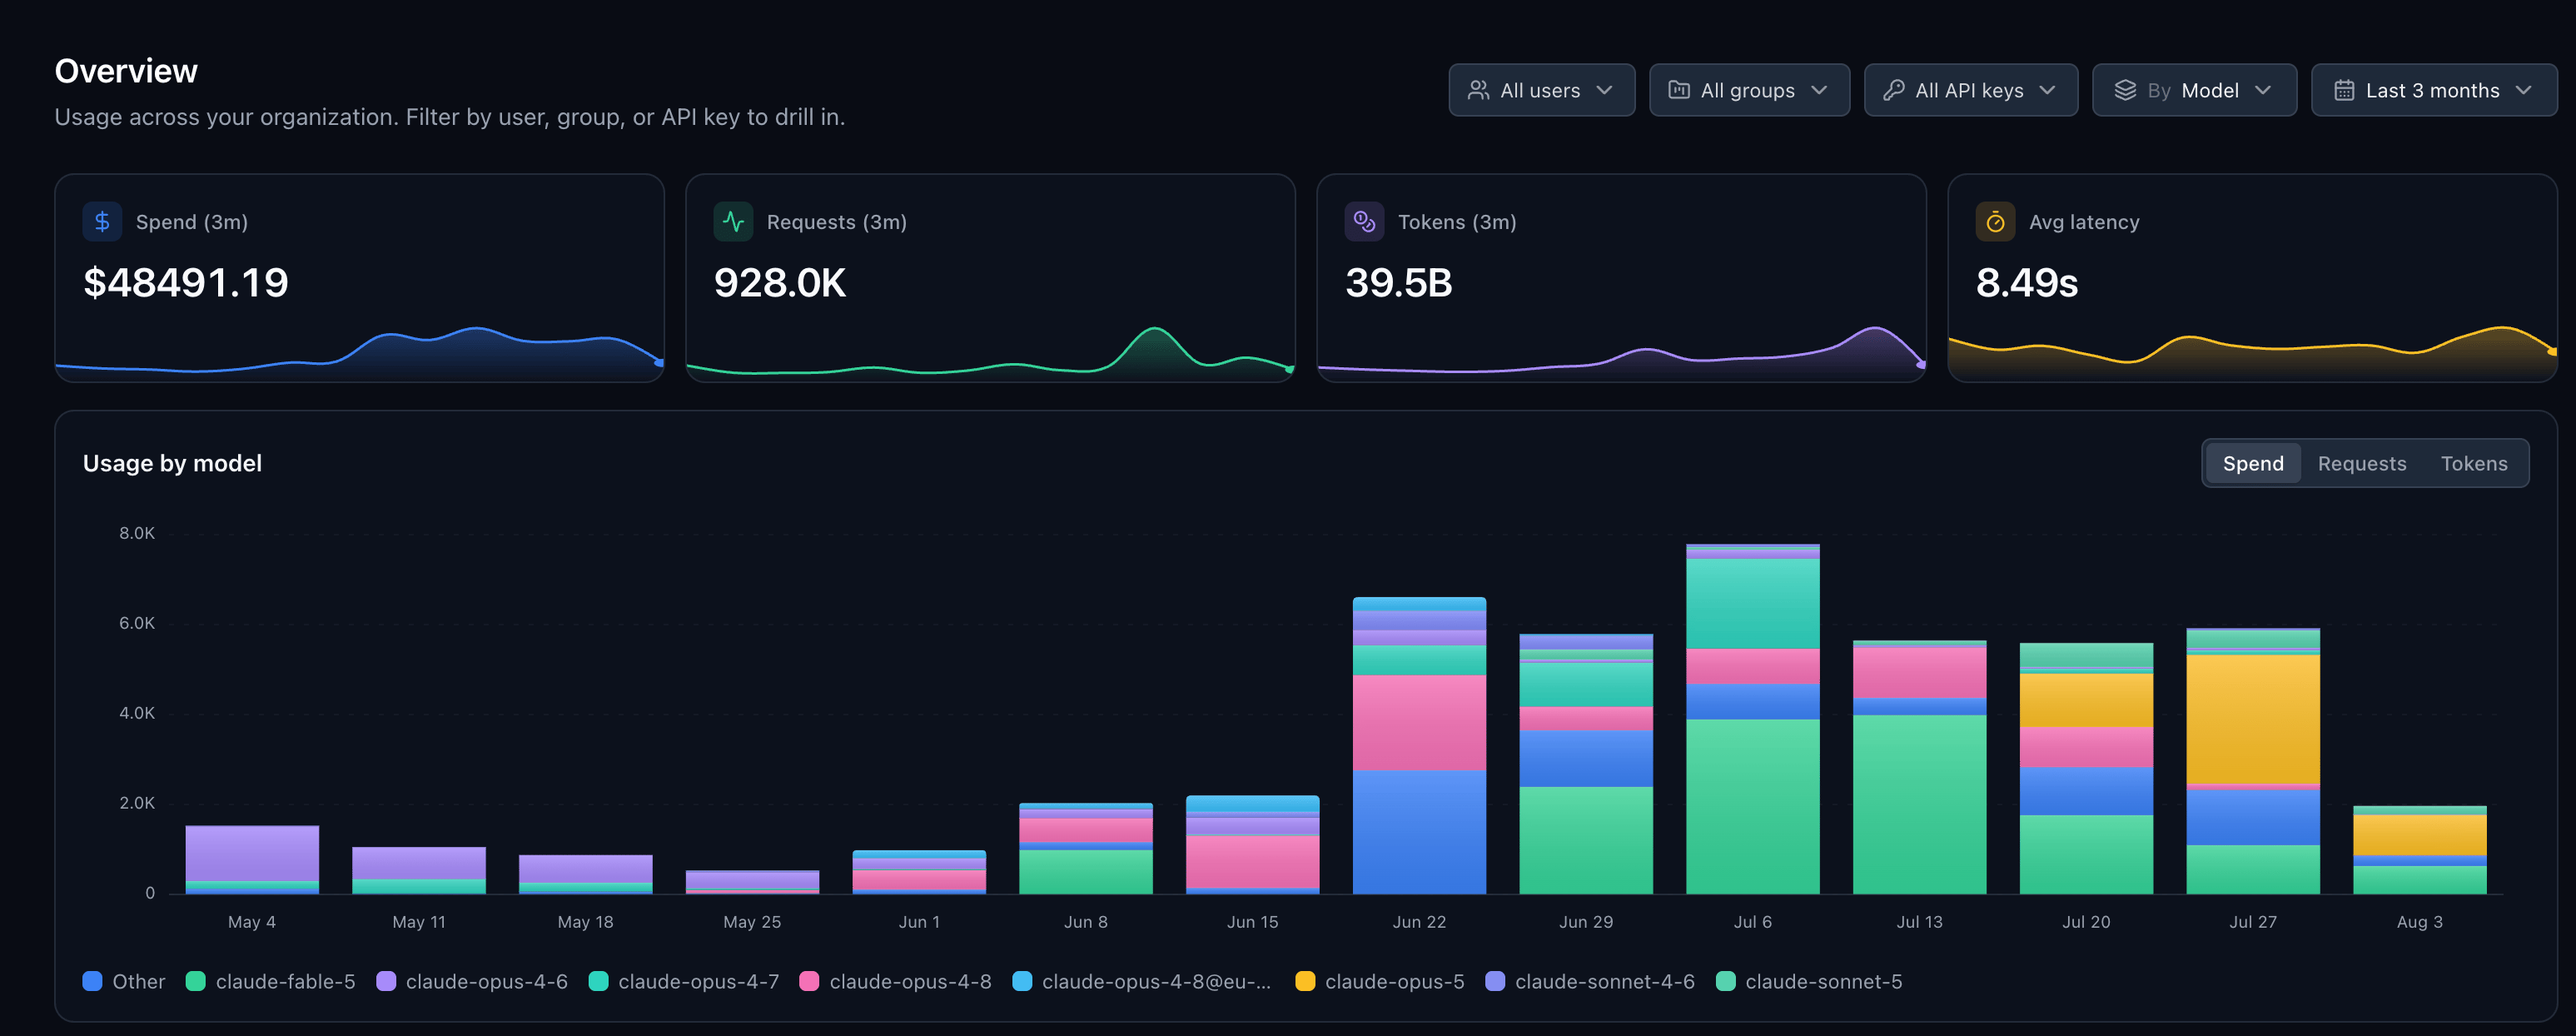
What you see
The page is built from four sections:- Stat tiles: Spend, Requests, Tokens, and Avg latency for the selected period, each with a sparkline trend. When you view this month and the spend shown is your own, the Spend tile also shows your monthly limit and how much of it you have used.
- Usage chart: A stacked bar chart over time. Toggle between Spend, Requests, and Tokens, and switch between absolute totals and percentages.
- Totals table: Every value in the selected dimension with its spend, requests, tokens, and share of the total. Click a row to drill in.
- Activity heatmap: A calendar of daily spend over the last year, so you can spot usage patterns at a glance.
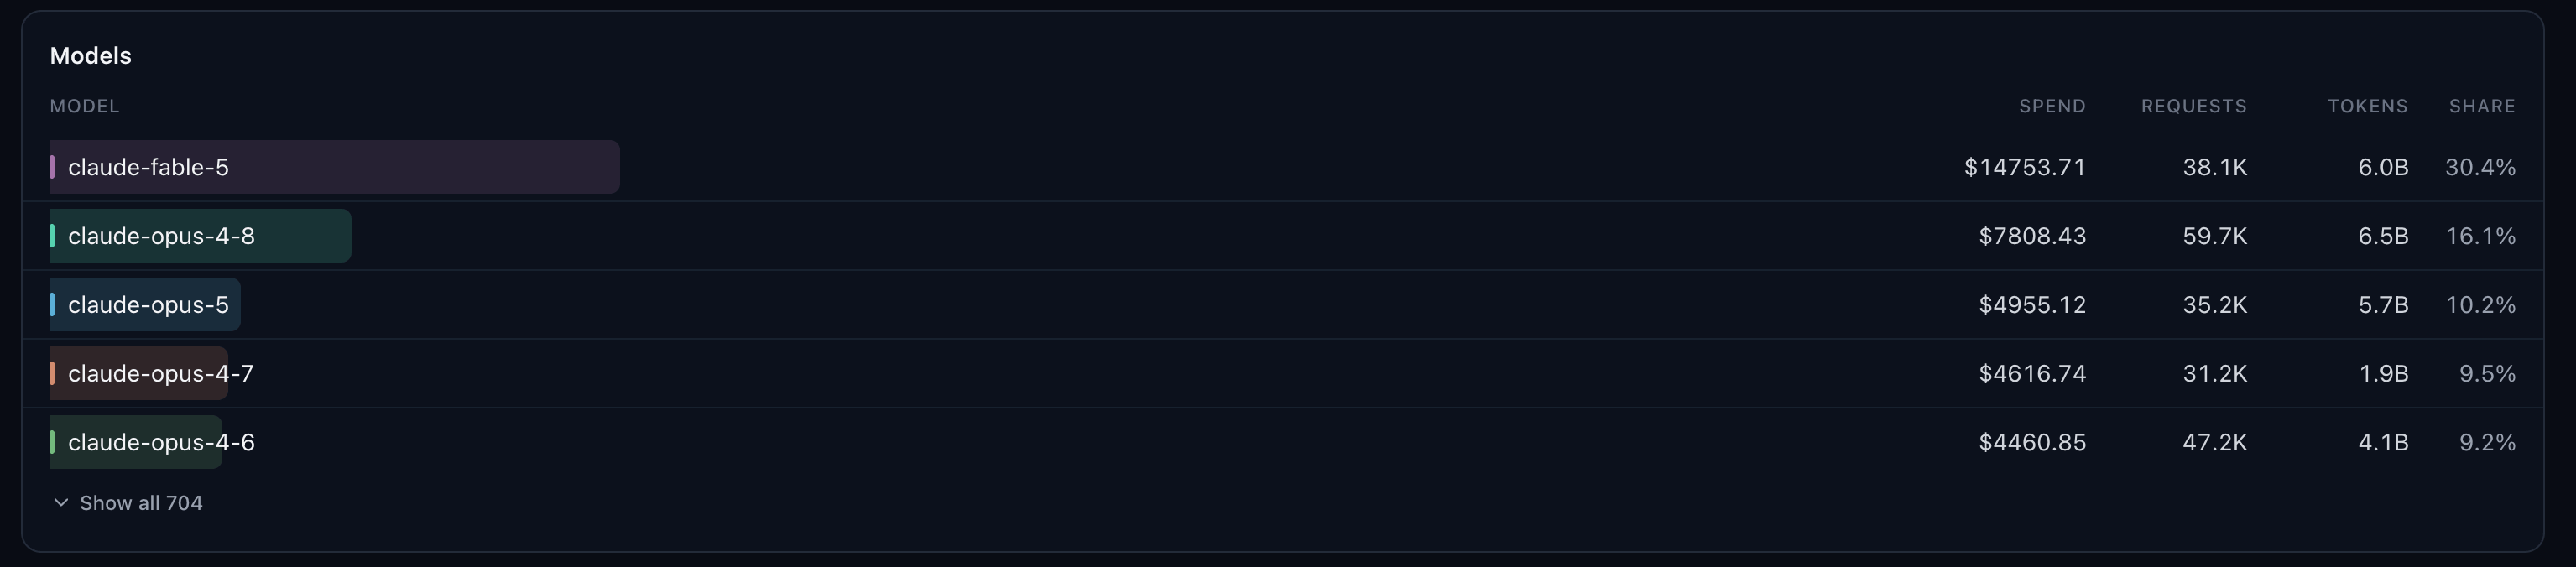
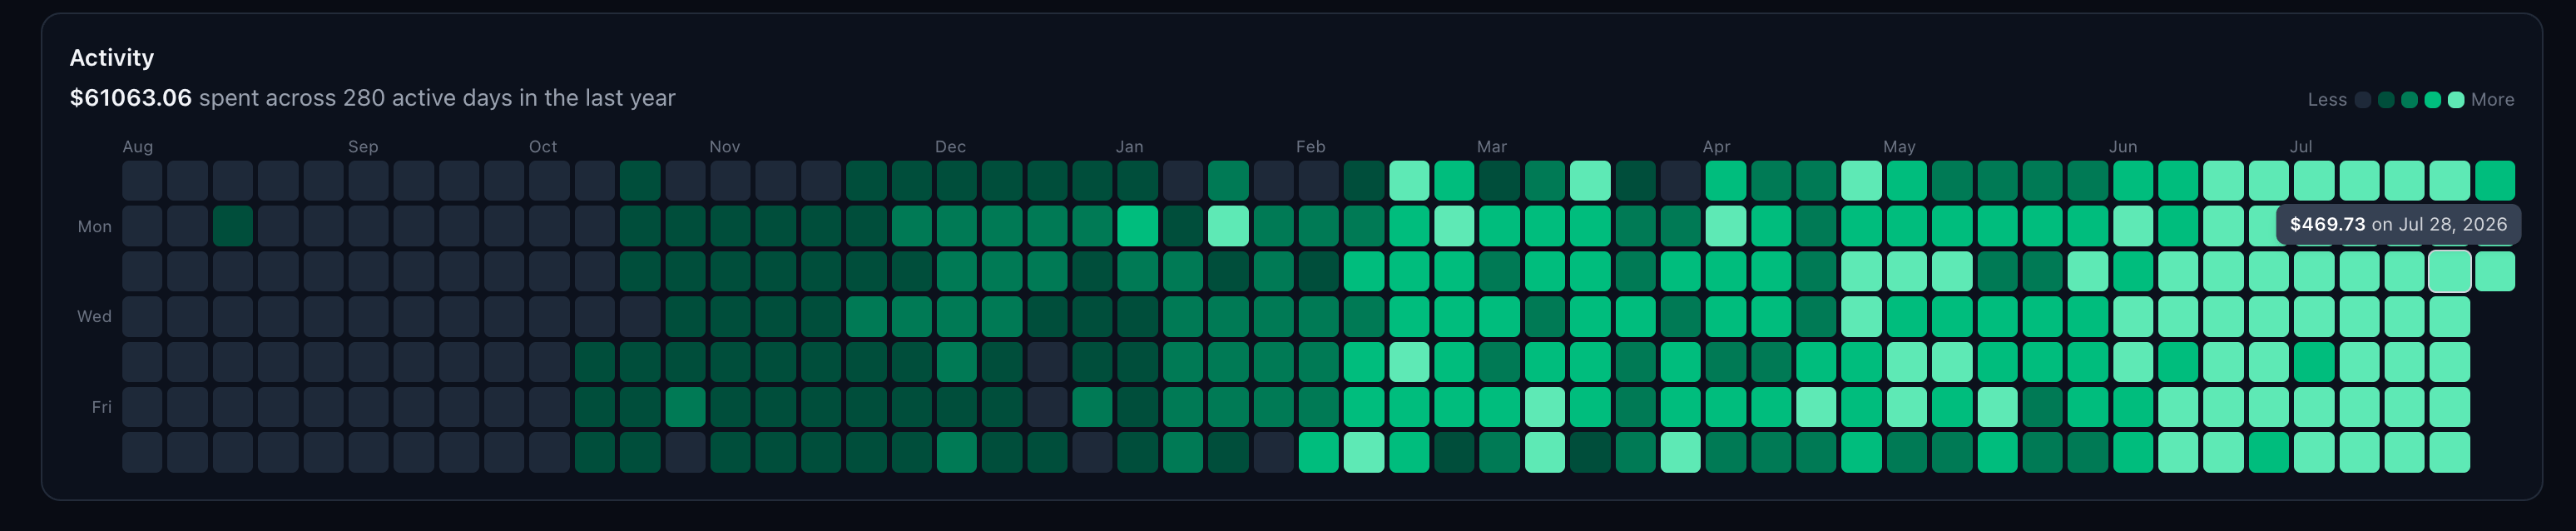
Group by any dimension
The By selector changes what the chart and table break down:
The Token type view breaks your token volume into input, output, cached, and reasoning tokens, which makes cache effectiveness and reasoning overhead easy to see. A tooltip on the chart shows the full token breakdown for each period.
Filters and drill down
Narrow the view with filters, each of which supports selecting multiple values:- Users: One or more organization members (admins only)
- Groups: One or more groups (Enterprise admins only)
- API keys: One or more API keys (everyone, scoped to the keys you can see)
Time periods
Choose from rolling windows (24 hours, 7 days, 30 days, 3, 6, or 12 months) or calendar periods (this week, this month, this quarter, this year). The default is this month.Who sees what (RBAC)
The Overview respects your role based access control rules:- Admins see usage across the whole organization and can filter by user, group, or API key to drill into any subset.
- Members see only their own usage, aggregated across all of their API keys. The user filter and the user and group dimensions are not available to them, and the backend scopes every query to their own data, so a shared URL cannot expose anyone else’s usage.
- Group features (the group filter and the group dimension) require an Enterprise plan.
Related features
- Usage Analytics for the full analytics dashboard with custom groupings and filters
- Cost Tracking for spend attribution and budgets
- Groups for organizing members and budgets
- RBAC for roles and permissions