

Open the Logs view in the Requesty Console.
Two View Modes
Toggle between Logs and Traces using the switcher in the top-right corner.
The Traces tab appears automatically when your requests include a
trace_id.
Logs View
The Logs table displays one row per API request with key metrics at a glance.Columns
Configure which columns are visible using the Columns button. Available columns include:
Column preferences persist across sessions.
Click-to-Filter
Click any value in the table to instantly filter by that field. For example, click a model name to see only requests for that model, or click a provider to filter by provider. Active filters appear as blue chips above the table. Remove a filter by clicking the x on its chip, or clear all filters at once.Inline Filters
Use the Add Filter button to filter by:- API (chat, embedding, image, speech, transcription, or decision); the other filter options follow the selected type
- Model Requested / Model Used
- Provider Requested / Provider Used
- Status (success / failure)
- API Key Name
- User Email / User ID
- Trace ID / Request ID
- Finish Reason / Status Code
- Custom feedback and extra fields
Pagination
Logs load in pages of 30. Use Previous and Next to navigate through your request history.Traces View
Traces group multiple requests that share the sametrace_id into a single card. This is useful for debugging multi-step agent runs, chain-of-thought flows, or any workflow that makes several LLM calls.
Trace Cards
Each trace card shows:- Trace ID with copy-to-clipboard
- Start time of the first interaction
- Call count, total tokens, total cost, and total latency
- Success rate across all interactions
- Cache hit rate average
Trace Filters
Filter traces by:- Trace ID: Find a specific trace
- API: Show one request type; the API selected in the logs view carries over
- API Key Name: Filter by which key generated the trace
- User Email: Filter by the user who triggered the trace
Compare Mode
Select two interactions from any trace and compare them side-by-side. Enter Compare Mode from the traces list, select two interactions, and view a diff of their messages, tokens, cost, and latency.Log Detail Panel
Click any row in the Logs table to open the detail panel. Navigate between logs with the left/right arrow buttons or keyboard arrows. Press Esc to close.Header
The panel header shows at a glance:- Status dot (green for success, red for failure)
- Model used
- Request ID (copyable)
- Cost, latency, token counts, and timestamp
Messages Tab
The Messages tab is a Logfire-style viewer that reconstructs the full conversation.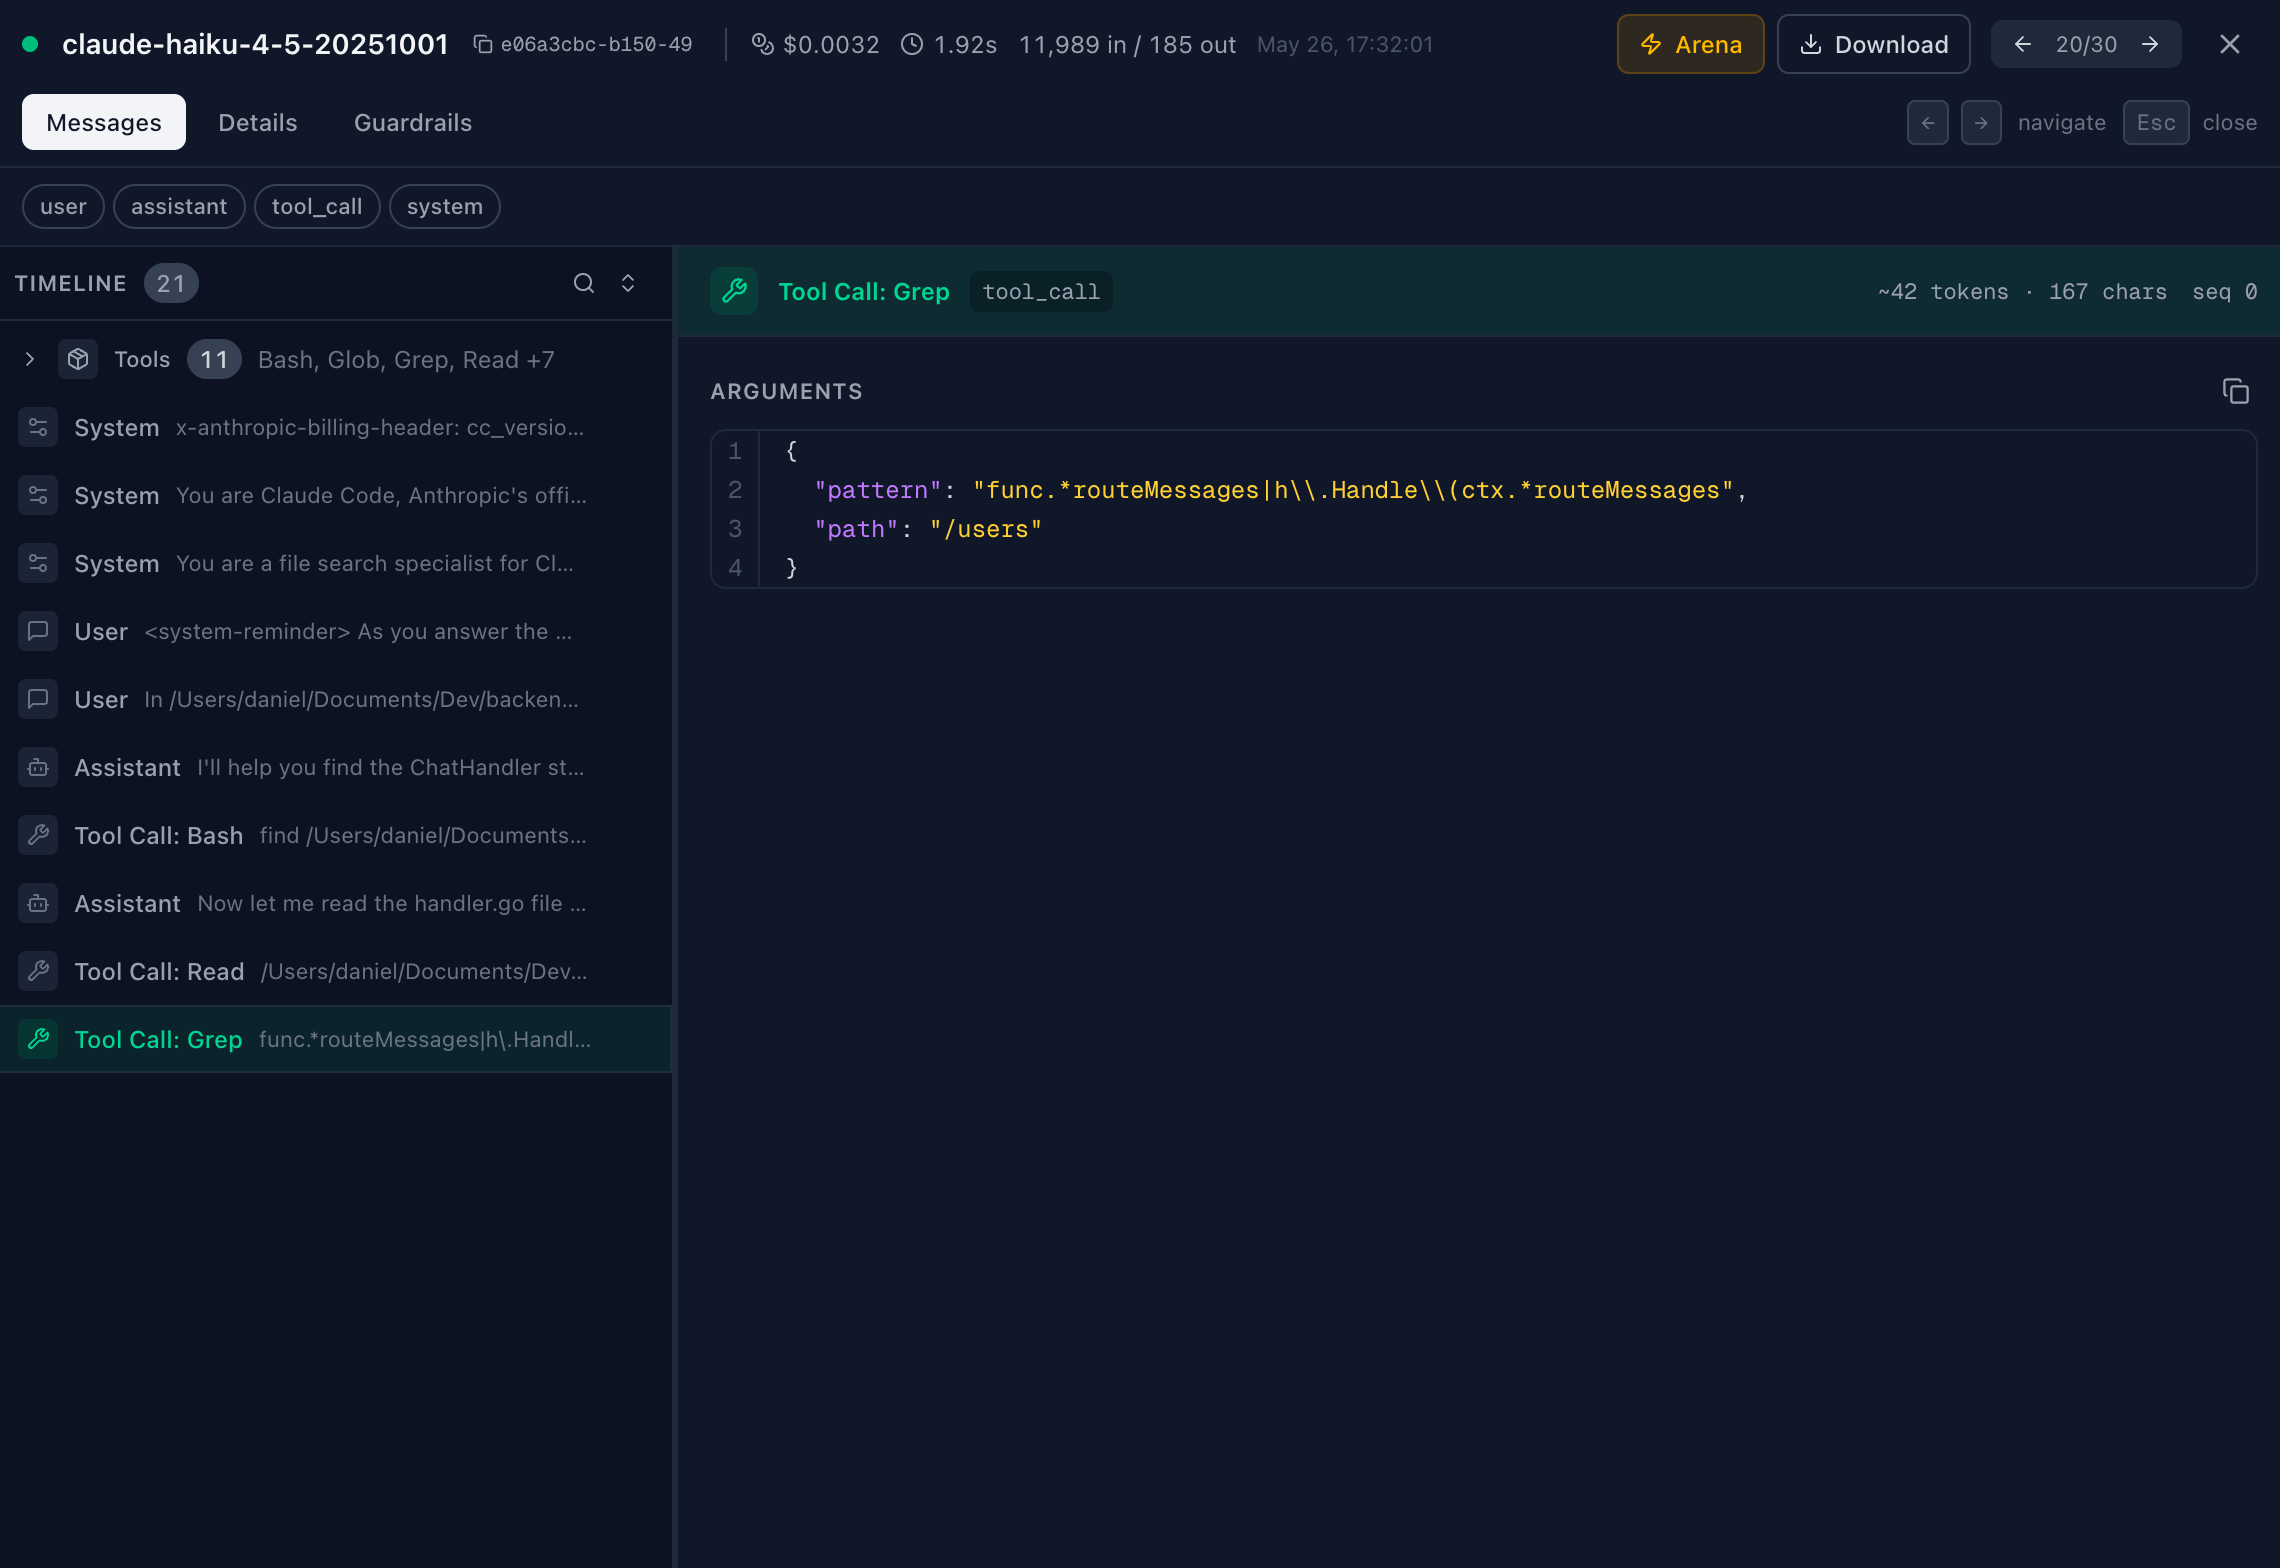
- System messages (amber) for system prompts
- User messages (blue) for user inputs
- Assistant messages (purple) for model responses
- Tool calls (green) for function/tool invocations
- Tool results (teal) for tool outputs
Details Tab
The Details tab shows structured metadata organized into sections:- Request: Model, provider, API key, user email, timestamp, finish reason, status code
- Performance: Input/output/cached/reasoning tokens, latency, TTFT (time to first token), cost, and cost without cache
- IDs & Tracking: Request ID, trace ID, session ID, user ID, context ID, response ID
- Tags: Custom tags attached via the API
- Feedback: User feedback data (thumbs up/down, ratings, custom fields)
- Extra Fields: Custom metadata sent with the request
Guardrails Tab
If you have Guardrails enabled, this tab shows any violations detected on the request, including PII detection, content policy violations, and other safety checks.Model Arena
Click the Arena button in the detail panel header to replay the same request against different models. Compare cost, latency, and response quality side-by-side to find cheaper or faster alternatives.Raw Request Download
Download the full raw HTTP request payload for any log entry using the download button in the header. Useful for debugging or reproducing issues locally.Trace Detail Panel
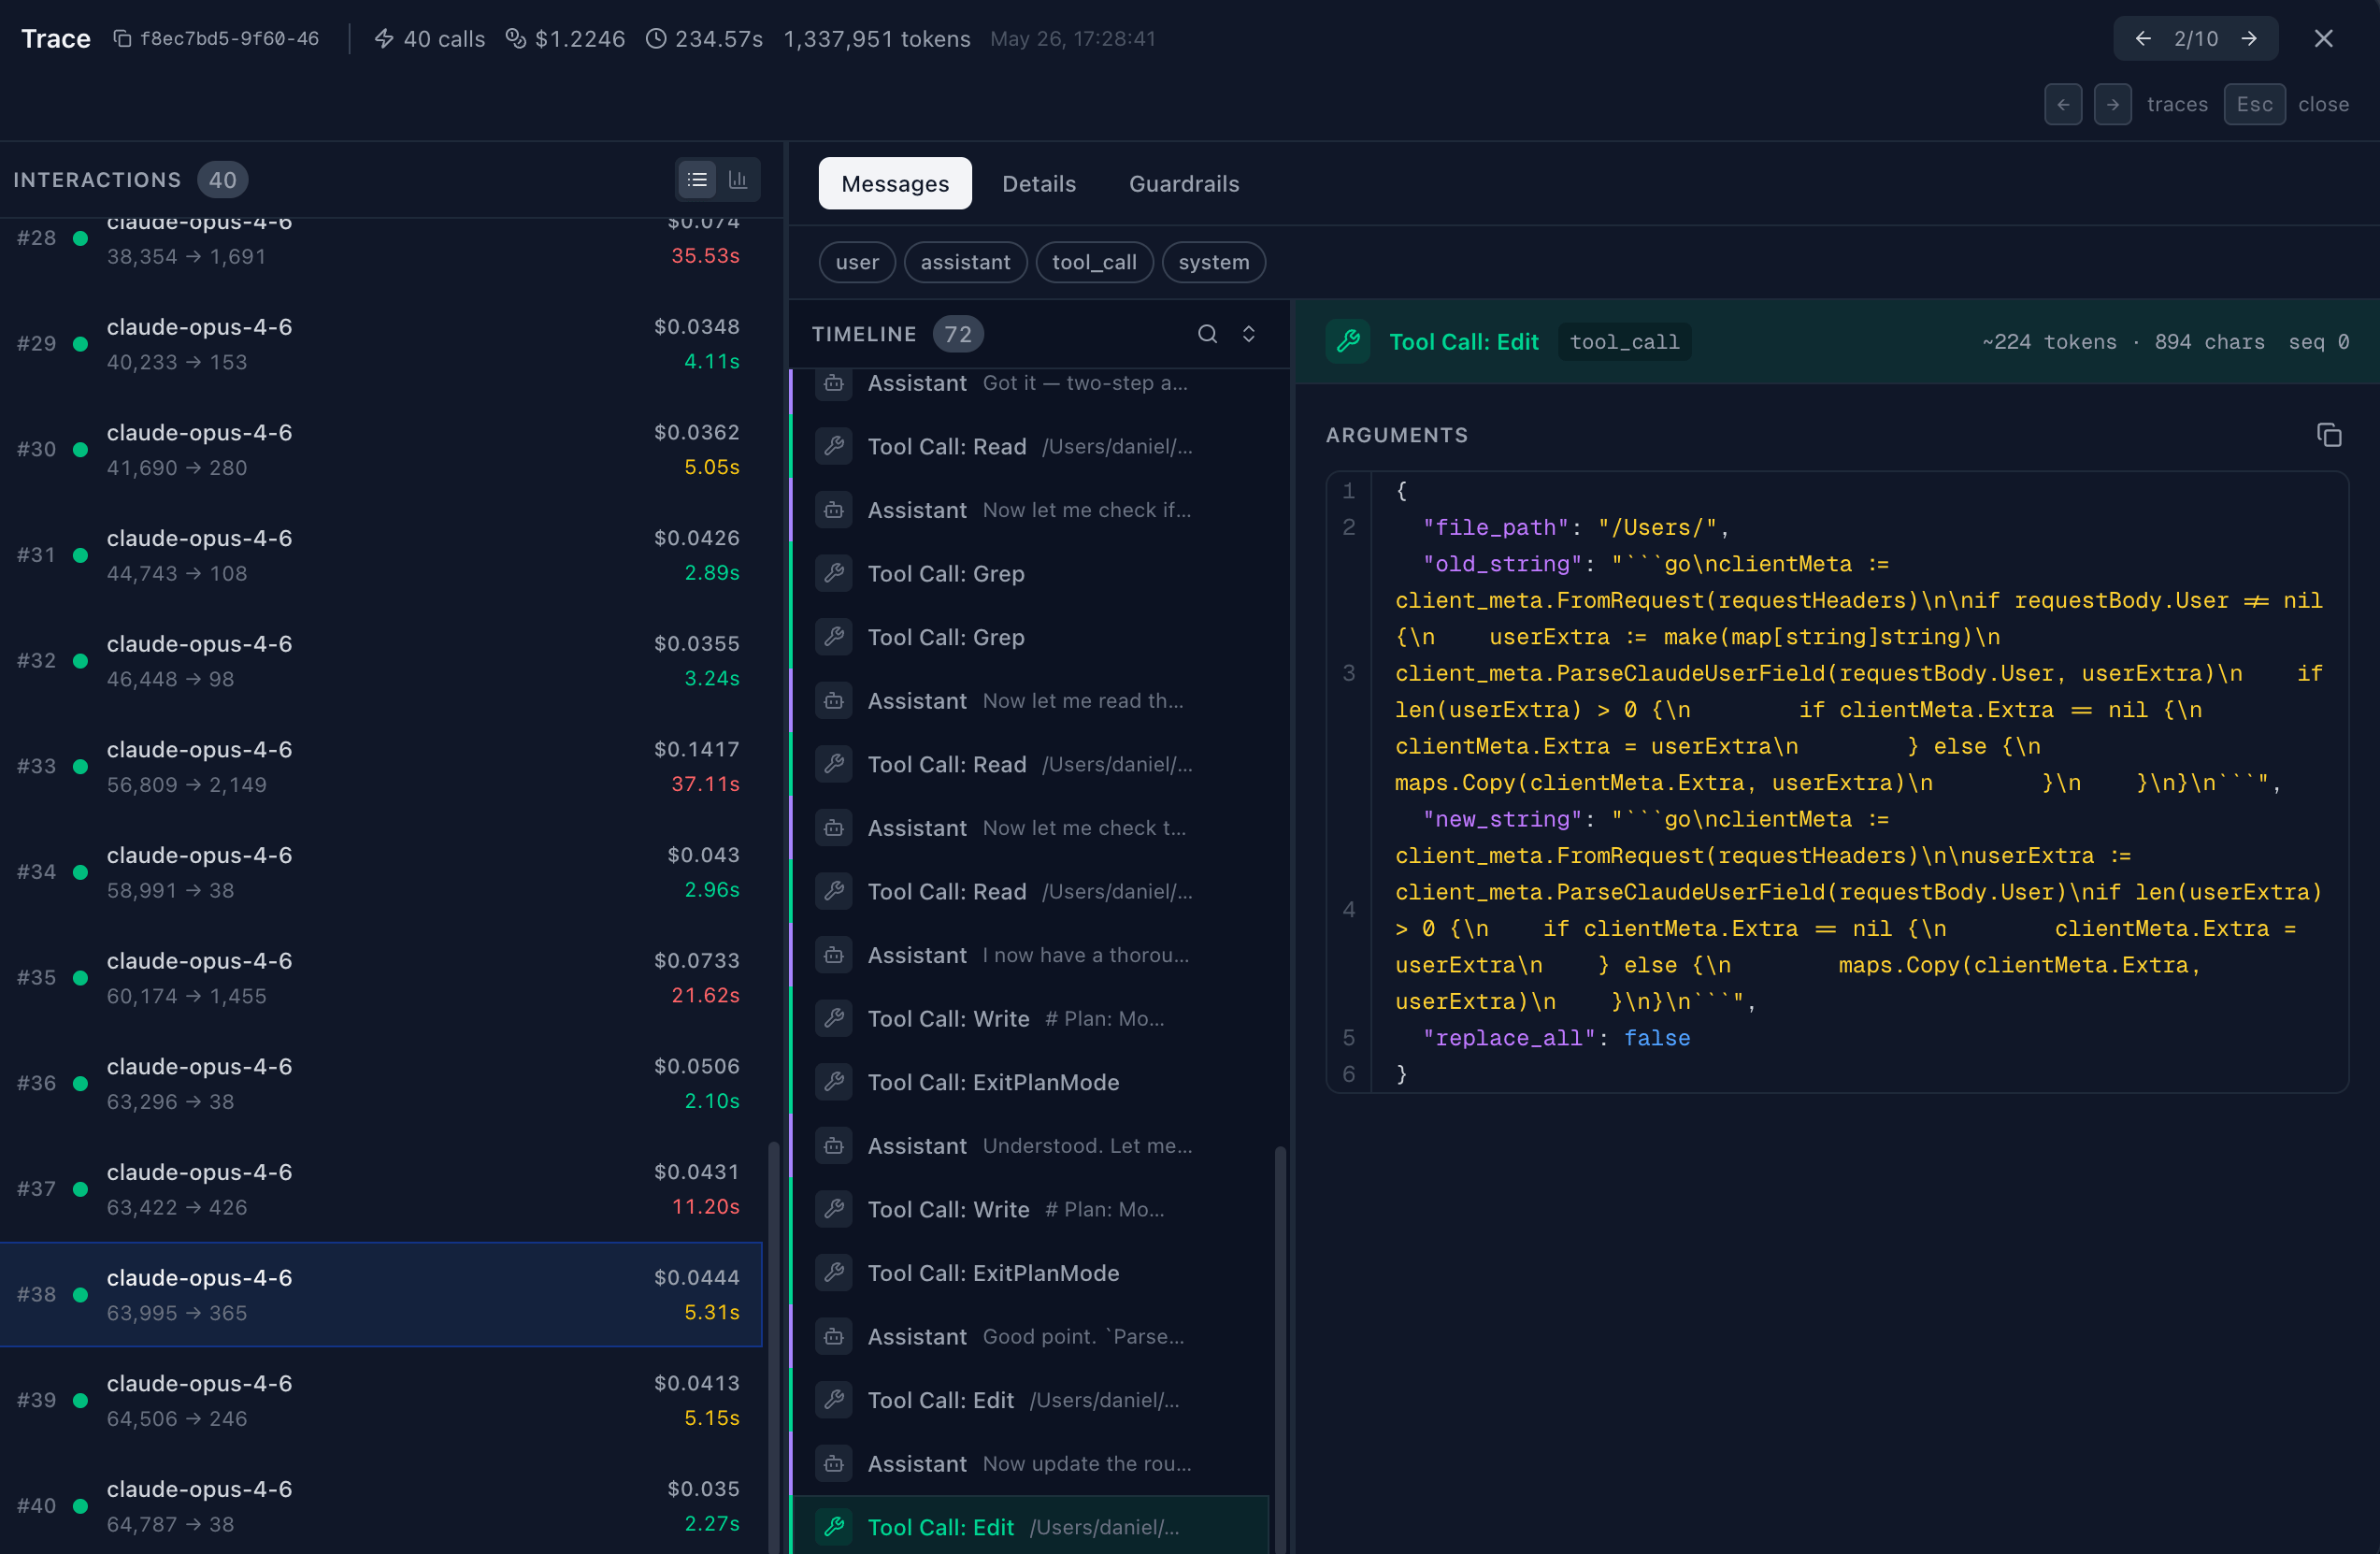
Click the eye icon on a trace card or select a trace to open the full trace detail panel.Layout
The trace detail panel uses a split-pane layout:- Left pane: List of all interactions in the trace, or a waterfall visualization
- Right pane: Full detail view of the selected interaction (Messages, Details, Guardrails)
Interaction List
Each interaction in the left pane shows:- Index number (#1, #2, #3…)
- Status dot (success/failure)
- Model name
- Token counts (input and output)
- Cost and latency with color coding (green for fast, yellow for moderate, red for slow)
Waterfall View
Toggle to Waterfall mode using the chart icon in the left pane header. This shows a Gantt-chart-style visualization of when each interaction started and how long it took. Bars are color-coded by provider:
The waterfall includes a time axis so you can see overlapping or sequential requests and identify bottlenecks.
Navigation
- Use left/right arrows (or keyboard shortcuts) to navigate between traces
- Press Esc to close the panel
- The header shows total calls, tokens, cost, and latency for the entire trace
Keyboard Shortcuts
Integration with Other Features
- Usage Analytics. Aggregate cost and usage metrics across all requests
- Cost Tracking. Per-request and per-trace cost breakdowns
- Request Metadata. Add custom fields that appear in log details
- Request Feedback. Attach user feedback to individual requests
- Session Reconstruction. Automatic grouping of related conversations
- Guardrails. Safety checks visible in the Guardrails tab
- Analytics Headers. Custom tracking headers that appear in logs